

RMX OPERATING INTELLIGENCE
Do You Really Know How Your Plant Is Performing?
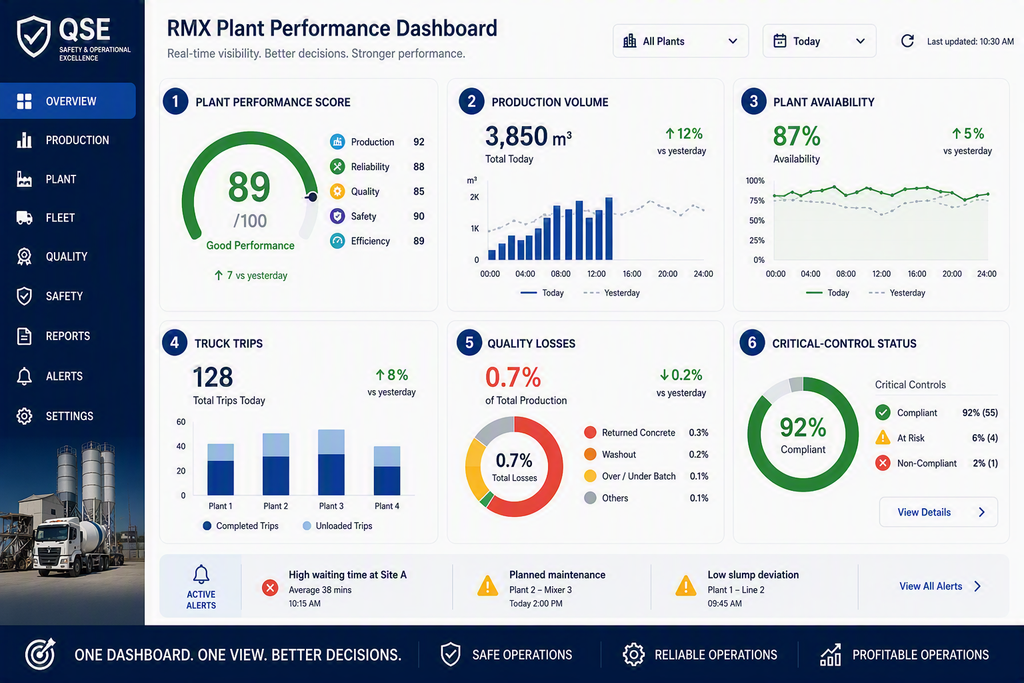
The RMX Plant Performance Dashboard helps concrete producers bring plant, fleet, quality, reliability and safety information into one practical management view.
See what is performing well, identify where value is being lost and focus management attention where action is required.
Can Your Current Reports Answer These Questions?
Most RMX plants already collect substantial data. The real challenge is converting that data into timely, reliable and actionable insight.
Plant Performance
Is the plant producing what it should?
See production volume, output rate, schedule attainment and plant utilization
Fleet Productivity
Are the trucks productive?
Understand trips per truck, cycle time, plant waiting and site waiting.
Reliability
Where is plant and truck availability being lost?
Truck downtime, breakdown frequency, preventive maintenance and recurring failures.
Quality
What quality losses are occurring?
Monitor rejected and returned loads, non-conformance, complaints and process variation.
Critical Risks
Are critical controls effective?
Make critical-control verification, overdue actions and repeated findings visible.
Business Performance
Where is the business losing value?
Identify waste, rework, unproductive time and selected cost-per-m3 indicators.
Most Plants Have Data. Few Have Visibility
Most RMX operations collect significant amounts of data every day through batching systems, dispatch records, maintenance logs, quality reports and spreadsheets.
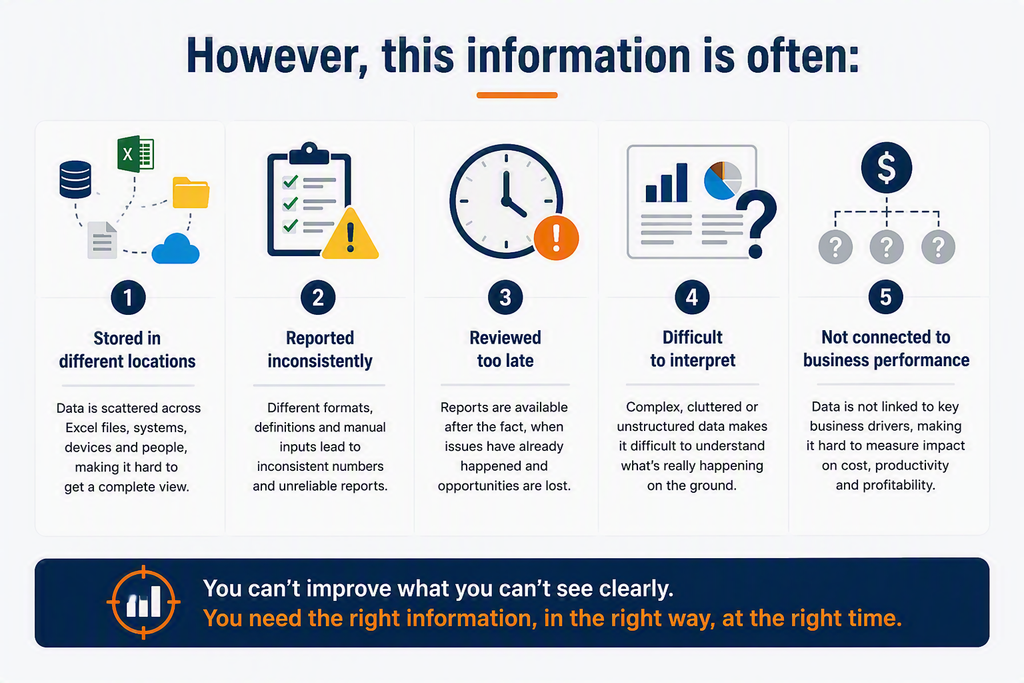
As a result, many owners and operational leaders struggle to answer simple but important questions about how their plants are actually performing.
Key Questions Every Owner Should Be Able To Answer
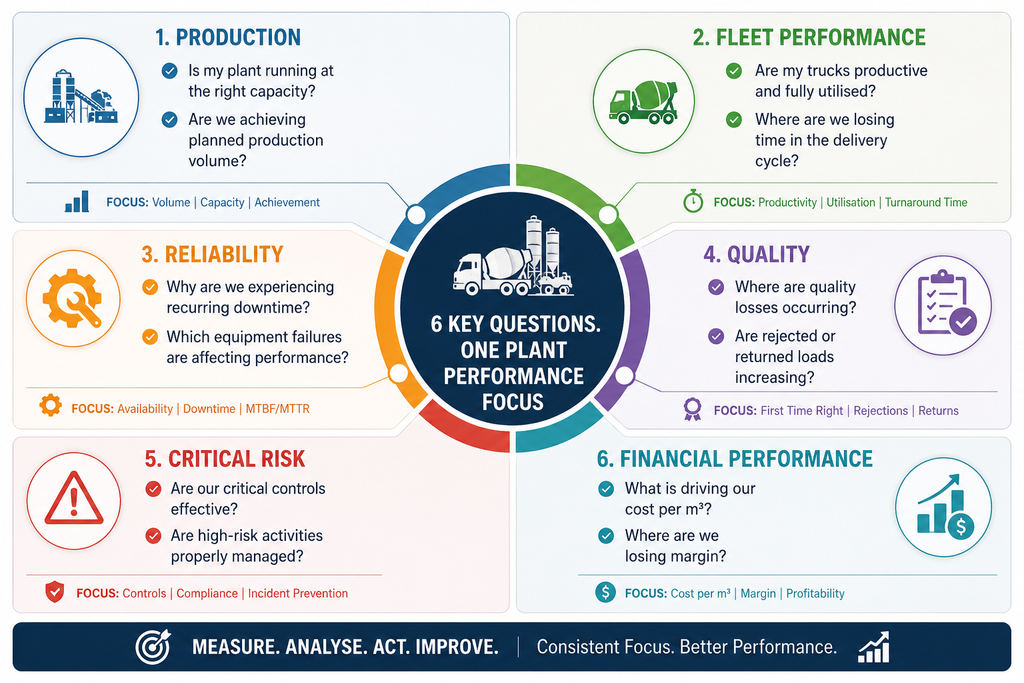
The RMX Plant Performance Dashboard brings operational, reliability, quality, safety and business information into a single integrated view, enabling faster decisions and better performance management.